Monthly AOV by Cohort: Formula and Shopify Examples
Many Shopify merchants track average order value (AOV) to understand how much customers spend per purchase.
However, overall AOV does not show the full picture.
A store may have a good average order value but still attract customers who spend less over time. It may also have newer customers who behave differently from older customers.
Cohort AOV per month helps merchants understand how customer spending changes after acquisition.
It shows which customer groups increase their spending, which groups decline, and what actions can improve revenue.
What Is Cohort AOV Per Month?
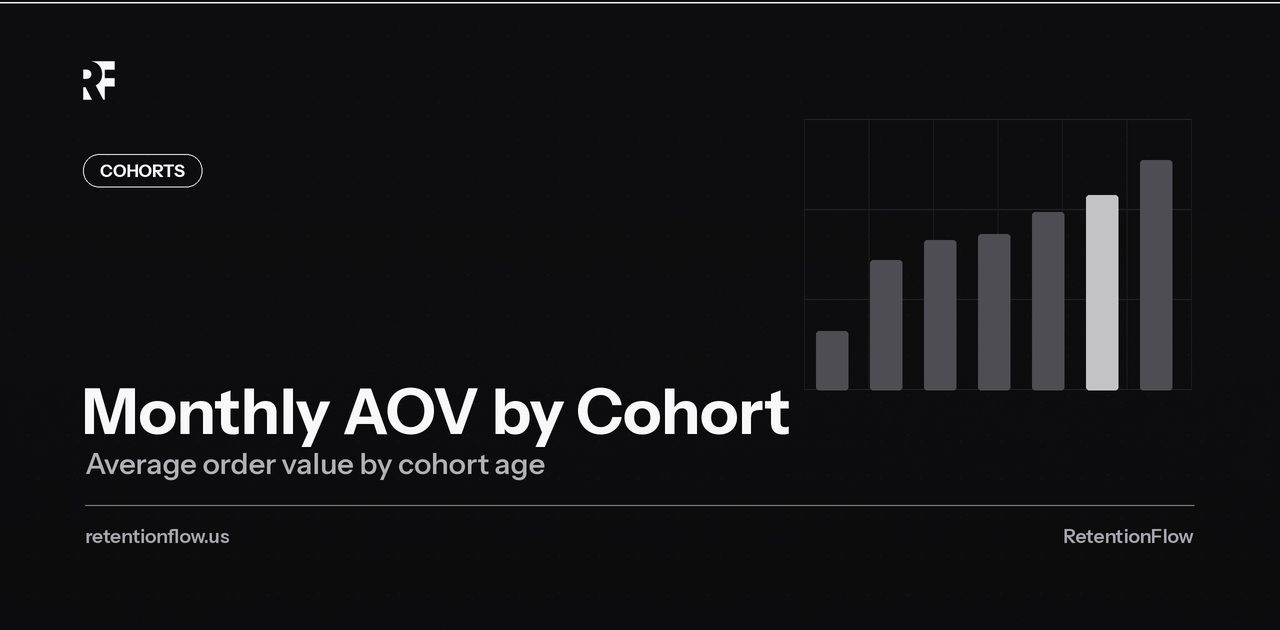
Cohort AOV per month measures the average order value of a specific customer group during different months after they join or make their first purchase.
A cohort is a group of customers who share a common starting point.
Examples:
- Customers who first purchased in January
- Customers acquired through Meta Ads
- Customers who bought a specific product
- Customers who joined a subscription
AOV means average order value.
The formula is:
AOV = Total Revenue ÷ Number of Orders
Cohort AOV combines these two ideas.
It shows how much each customer group spends over time.
Why Regular AOV Is Not Enough
Regular AOV tells you the average value of all orders.
Example:
A Shopify store generates:
- $100,000 in revenue
- 2,000 orders
AOV:
$100,000 ÷ 2,000 = $50
This number is useful, but it does not answer:
- Are new customers spending more or less?
- Do customers from certain channels spend more?
- Does customer spending increase after the first purchase?
- Which customers create more revenue over time?
Cohort AOV answers these questions.
How Does Cohort AOV Analysis Work?
Cohort AOV analysis follows a simple process.
Step 1: Create Customer Groups
First, group customers based on a shared event.
Common ecommerce cohorts include:
- First purchase month
- Marketing channel
- First product purchased
- Customer type
Example:
January first-time buyers become the January cohort.
Step 2: Track Monthly Spending
Measure how each cohort spends after their first purchase.
Track:
- Number of orders
- Revenue
- Average order value
- Repeat purchases
Step 3: Compare Cohorts
Compare different customer groups.
Example:
Do January customers spend more after three months than February customers?
Step 4: Take Action
Use insights to improve:
- Product offers
- Marketing campaigns
- Upsells
- Customer retention
Cohort AOV Per Month Example
Imagine a Shopify skincare brand wants to understand customer spending.
The store creates cohorts based on the first purchase month.
| Customer Cohort | Month 1 AOV | Month 2 AOV | Month 3 AOV |
|---|---|---|---|
| January Buyers | $45 | $55 | $68 |
| February Buyers | $50 | $62 | $75 |
| March Buyers | $48 | $58 | $64 |
The February cohort shows stronger spending growth.
The merchant can investigate:
- Which products did February customers buy?
- Which campaign brought them?
- Did a new offer improve sales?
This information helps improve future strategies.
Why Shopify Merchants Should Track Cohort AOV
Cohort AOV helps merchants understand customer quality, not just sales volume.
Understand Customer Value
Not every customer creates the same revenue.
Two customers may make one purchase, but one may continue buying while the other disappears.
Cohort AOV helps identify valuable customer groups.
Improve Product Strategy
Cohort AOV can show which products increase spending.
Example:
A fashion store discovers that customers who buy complete outfits spend more over time than customers who buy single items.
The store can create more bundle offers.
Improve Marketing Decisions
A cheaper customer acquisition channel is not always better.
A channel that brings customers with higher AOV may create better long-term results.
Example:
| Channel | Customer AOV |
|---|---|
| Meta Ads | $45 |
| Google Ads | $70 |
| Referral | $85 |
Referral customers may be more valuable even if they arrive in smaller numbers.
Cohort AOV vs Regular AOV
Both metrics are useful, but they answer different questions.
| Metric | What It Shows |
|---|---|
| Regular AOV | Average spending across all orders |
| Cohort AOV | Spending behavior of specific customer groups over time |
Regular AOV helps measure overall store performance.
Cohort AOV helps explain customer behavior.
Cohort AOV and Customer Lifetime Value
Cohort AOV becomes more powerful when combined with customer lifetime value (CLV).
CLV measures the total value a customer creates over their relationship with a brand.
Higher AOV can improve CLV because customers generate more revenue per purchase.
Example:
| Metric | Customer Group A | Customer Group B |
|---|---|---|
| Average Order Value | $40 | $80 |
| Purchases Per Year | 5 | 5 |
| Annual Customer Value | $200 | $400 |
Customer Group B creates more value even with the same purchase frequency.
This helps merchants decide where to invest in customer acquisition and retention.
How to Increase Cohort AOV
Create Product Bundles
Bundles encourage customers to buy more products in one order.
Examples:
- Starter kits
- Product collections
- Multi-item discounts
A skincare store may sell a complete routine instead of a single product.
Add Upsells and Cross-Sells
Upsells encourage customers to choose higher-value options.
Cross-sells recommend related products.
Examples:
- Add accessories
- Offer premium versions
- Recommend complementary items
Improve Customer Retention
Returning customers often spend more because they already trust the brand.
Improve retention with:
- Email campaigns
- Loyalty programs
- Personalized recommendations
- Subscription options
Create Better Offers
Discounts should increase order value, not only reduce prices.
Examples:
- Spend $75 and get free shipping
- Buy two products and save 10%
- Bundle savings
How Shopify Merchants Can Create a Monthly Cohort AOV Report
A simple report follows five steps.
Step 1: Define the Goal
Start with a question.
Examples:
- Which customers spend more over time?
- Which channel creates high-value buyers?
- Did a new product improve spending?
Step 2: Choose the Cohort
Select how customers will be grouped.
Examples:
- First purchase month
- Product purchased
- Marketing source
Step 3: Select Metrics
Track:
- Revenue
- Orders
- AOV
- Repeat purchase rate
- Customer lifetime value
Step 4: Analyze Trends
Look for:
- Increasing AOV
- Decreasing spending
- High-value cohorts
Step 5: Improve Your Strategy
Use findings to improve:
- Marketing
- Product offers
- Customer experience
Common Cohort AOV Mistakes
Looking Only at Overall AOV
A single AOV number hides customer differences.
Different groups may behave differently.
Ignoring Customer Retention
AOV becomes more valuable when you understand repeat purchases.
A high first order does not always mean a valuable customer.
Comparing Incomplete Cohorts
Newer cohorts have less time to purchase again.
Compare customers over similar periods.
Making Decisions From Small Data Sets
Small groups can create misleading results.
Use enough customer data before changing your strategy.
A Simple 90-Day Cohort AOV Improvement Plan
Days 1 to 30
Focus on:
- Calculate current cohort AOV
- Identify valuable customer groups
- Review product performance
Days 31 to 60
Focus on:
- Test bundles
- Improve upsells
- Create targeted offers
Days 61 to 90
Focus on:
- Scale successful strategies
- Improve retention
- Increase customer lifetime value
Frequently Asked Questions
What is cohort AOV?
Cohort AOV measures the average order value of a specific customer group over time.
How do you calculate AOV by cohort?
Calculate cohort AOV by dividing the total revenue from a customer group by the number of orders from that group.
Formula:
Cohort Revenue ÷ Cohort Orders = Cohort AOV
Why should Shopify stores track cohort AOV?
Shopify stores track cohort AOV to understand customer spending patterns, improve marketing decisions, and increase revenue.
What is a good AOV for ecommerce?
A good AOV depends on product price, margins, customer behavior, and business goals.
How does cohort AOV help customer retention?
Cohort AOV shows whether customer spending increases or decreases after the first purchase, helping merchants improve retention strategies.
Final Thoughts
Cohort AOV per month gives Shopify merchants a clearer view of customer spending behavior.
Instead of looking only at total sales, merchants can understand which customers create long-term value.
When combined with cohort analysis, customer lifetime value, and retention data, AOV insights help stores build smarter growth strategies.